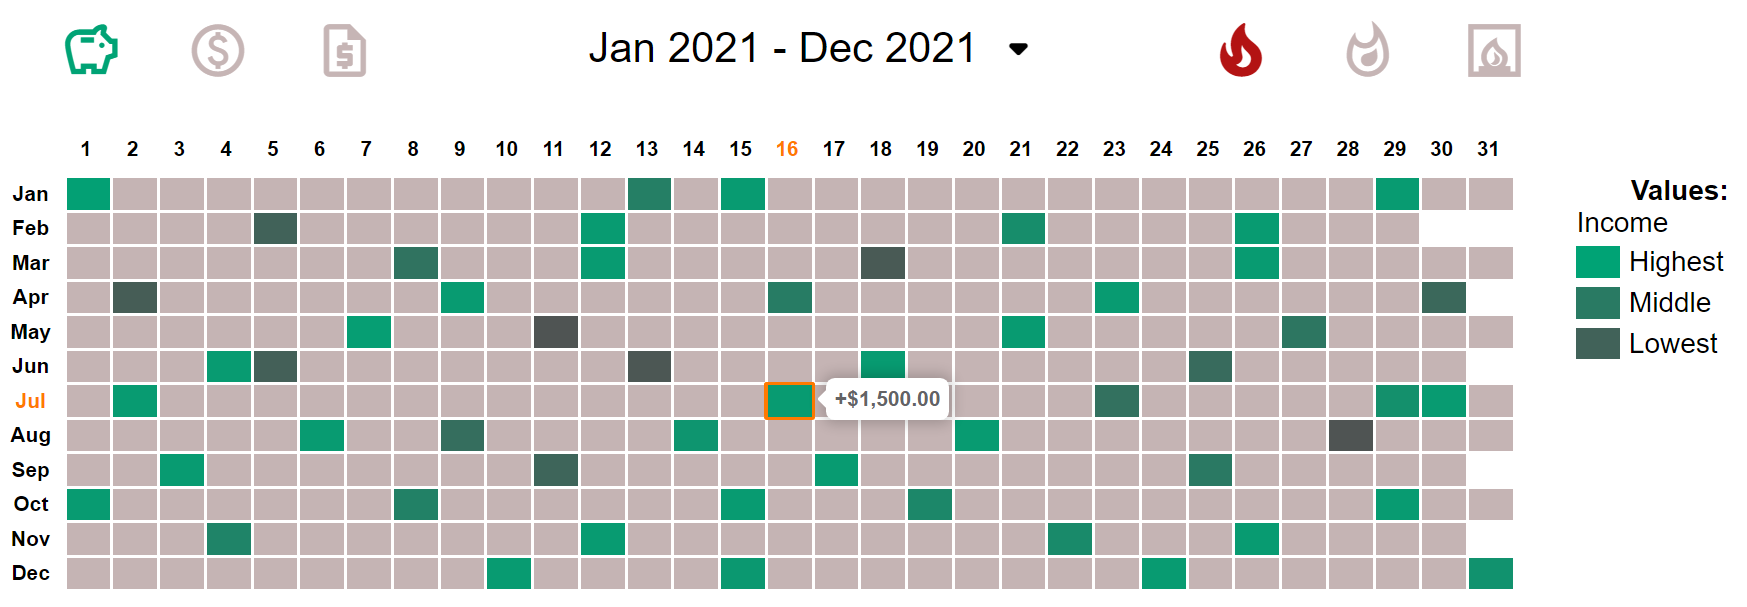
Heatmap for YNAB
A report that displays your YNAB transactions in a heatmap style to get a bird's eye view of your budget.

Features
- Options
- Income - Transactions greater or equal to 0.
- Expense - Transactions less than 0.
- Net - Difference between income and expense transactions.
- Heatmap styles
- Sequential - A gradual change from an option color at high end to darker saturated option color at the low end.
- Grouping - Group of 4 colors instead of gradual change of 1 color.
- Simple - Just a simple 1 color view with no changes.
- Calendar Views
- Yearly - All 365/366 days of the year view. Seen from above screenshot.
- Monthly - Each of the 12 months of the year. (Ex. Aug, Sept, Oct)
- Days of Month - View of each day of the month. (Ex. 13th, 14th, 15th)
- Weeks of Month - Similar to days of month but by weeks. (Ex. 2nd Week(8th-14th))
- Days of Week - 7 days of the week. (Ex. Sun, Mon, Tue)
- Similar YNAB functions
- Transactions List - Clicking on sections will bring up all the transaction for that section with the addition of sorting.
- Filters - Ability to limit transactions shown by Category, Accounts and the addition of Payees.
- Date Ranges - Look at transactions within a given date range.
Customization
- Color-blind Accessibility
- Options - Able to change income and expense colors
- Groupings - Change the 4 groups colors for income and expense
- Themes
- Don't like the theme or want to change it up? There are the 3 YNAB themes along with the main heatmap one.
